
KDI FOCUS Why the Capital Region Keeps Growing: Urban Accounting and Spatial Policy Implications January 20, 2026
Why the Capital Region Keeps Growing: Urban Accounting and Spatial Policy Implications
January 20, 2026-
Sunham Kim
 프로필
프로필


Population concentration in the Seoul Metropolitan Area has continued unabated since the 1970s. In the 2010s, diverging productivity drove this trend—gains in semiconductor and knowledge-based sectors in the capital region versus losses in manufacturing-oriented regional cities. Planned city projects, including Sejong, heavily prioritized infrastructure provision, yielding limited productivity growth and only modest population inflows. To achieve balanced development, spatial policy should move beyond infrastructure investment to boosting regional productivity. Furthermore, narrowing the divide between the capital region and outer regions may necessitate accepting some disparities within outer areas.
Ⅰ. The Challenge of Persistent Capital Concentration
Since 2019, more than half of Korea’s total population has resided in the capital region, known as the Seoul Metropolitan Area (SMA). While population concentration in large metropolitan areas is a global phenomenon, Korea’s urban primacy is exceptional. Despite over three decades of balanced national development plans and extensive planned city initiatives, Korea has continued on a one-way trajectory without interruption since the 1970s. This unidirectionality suggests that the forces driving SMA concentration have consistently outweighed policy interventions during this timeframe. The recent industrial restructuring and the subsequent decline of traditional manufacturing cities illustrate one facet of this broader trend.
Despite three decades of balanced national development plans, SMA concentration has intensified unabated.
This persistence prompts a reevaluation of the design and feasibility of balanced national development initiatives. As SMA concentration and regional collapse increasingly raise equity concerns, spatial policy must account for impacts not only on individual cities but also on the national economy as a whole. Moreover, regional investments that fail to enhance productivity are unlikely to deliver lasting outcomes. Against this backdrop, this study examines the economic and social forces that shape city sizes and their spatial distribution in Korea to derive key policy implications.
Ⅱ. Determinants of City Size
Seoul’s population stands at approximately 9.3 million (2024 Population Census ). Why 9.3 million, rather than 15 million or 5 million? Urban economics explains city size as the equilibrium between two opposing forces: one that attracts population and the other that constrains its growth.
Cities draw population by providing both economic and non-economic advantages.
Fundamentally, people are drawn to cities by both productivity and amenities. Cities with higher productivity can sustain higher wages and more employment opportunities, thereby attracting workers. Cities with superior amenities are appealing in their own right. Even at the same wage level, places with favorable natural environments, such as Jeju Island, or with safer living conditions can attract larger populations.
Cities cannot grow indefinitely, as congestion intensifies with expansion.
However, the most productive or livable city does not host the whole population. As cities expand, commuting times lengthen and housing costs rise. Once these congestion costs exceed agglomeration benefits, net population outflows increase. How then are dense megalopolis like Seoul possible? The key is the relatively low marginal congestion costs of accommodating additional residents. In cities with highly integrated public transit networks, as seen in Seoul, population growth poses smaller congestion burdens than in those without them. This study refers to these as “urban accommodation costs,” which vary across cities depending on their infrastructure, geography, and governance. Holding productivity and amenities constant, cities with lower accommodation costs can absorb larger populations and continue to grow. Where accommodation costs are high, by contrast, congestion intensifies rapidly even at modest population levels, curbing further expansion.
City size increases as productivity and amenities rise and accommodation costs fall.
Through population mobility, local changes in city characteristics spill over nationwide.
Each city possesses its own level of productivity, amenities, and urban accommodation costs, which collectively determine city size. These three characteristics operate through distinct channels in the urban labor market (Figure 1). Higher productivity allows cities to offer higher wages, which in turn support larger populations. Higher amenities make cities more attractive to live in, even at a given wage level, allowing population to expand despite relatively lower wages―in effect, favorable living conditions compensate for lower earnings. Where urban accommodation costs are high, congestion costs rise steeply as the population grows. Offsetting these costs requires higher wages, which constrains population size while pushing wages upward. Overall, cities tend to be larger where productivity and amenities rise, and urban accommodation costs fall.
With free mobility across cities, changes in any one city can trigger national population reallocation, ultimately affecting aggregate economic outcomes. Accordingly, when policy interventions or other external factors enhance a city’s productivity or reduce its accommodation costs, their effects must be assessed at both the city and the national levels.

III. The Impact of Changing City Characteristics on SMA Concentration
This study employs the spatial general equilibrium model of Desmet and Rossi-Hansberg (2013) to estimate productivity, amenities, and urban accommodation costs for 161 cities and counties in Korea. These estimates enable a macro-level analysis of how changes in city characteristics have influenced city size distribution. Focusing on productivity, this analysis identifies drivers of SMA concentration in the 2010s and derives spatial policy implications.
To estimate nationwide city characteristics, the analysis draws on data including working-age population, total employment, Gross Regional Domestic Product (GRDP), productive capital, and consumption. Productivity is measured as total factor productivity, where higher values reflect greater output for a given level of labor and capital inputs. Amenities are defined as the willingness to pay to reside in a city, given its productivity, congestion costs, and employment rates in equilibrium. Urban accommodation costs are inferred from congestion levels relative to population size. These costs are lower in cities with higher employment rates and higher output-to-consumption ratios.
This analysis covers the period from 2005 to 2019. Figure 2 presents the estimated city characteristics over this period. For ease of interpretation, productivity and urban accommodation costs are normalized to a national average of 100 in 2005, while amenities are normalized to 100 in each year. As such, changes in productivity and urban accommodation costs can be interpreted as growth rates. However, changes in amenities capture shifts in a city’s relative position vis-a-vis the national average at a given point in time and should not be taken as growth rates.
Productivity in the SMA not only exceeded non-SMA levels but also grew at a faster rate.
In 2005, the average productivity in SMA cities was 101.4% of the national average, compared to 98.7% for non-SMA cities―a modest initial edge for the capital region. By 2019, the national average had increased by 16.1%. Over this period, productivity growth in the SMA (20.0%) surpassed that in non-SMA regions (12.1%) by roughly 8%p, raising SMA productivity to 121.7% and widening the gap with non-SMA areas (110.6%).
Amenities were consistently higher in non-SMA regions, a pattern strengthened over 15 years.
With respect to amenities, non-SMA cities consistently maintained higher levels, indicating a trade-off where superior amenities compensate for the lower consumption levels stemming from lower productivity and wages. Between 2005 and 2019, the SMA’s relative amenities declined (―1.6%p), while that of non-SMA areas improved (2.0%p), reinforcing the latter’s relative advantage.
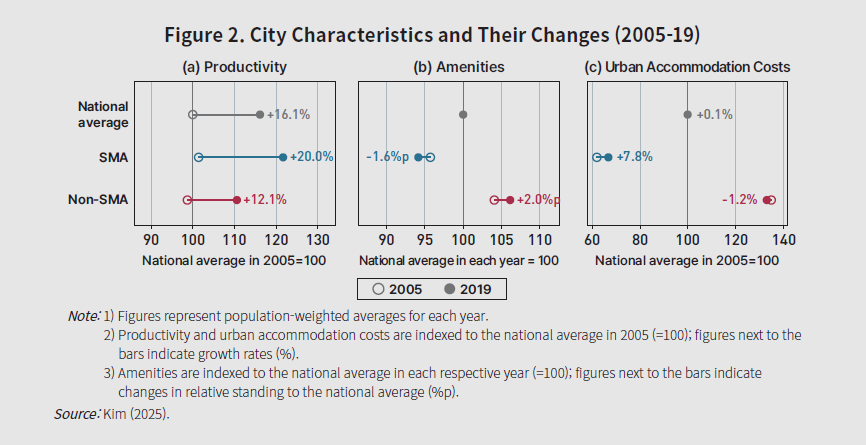
Urban accommodation costs were consistently lower in the SMA than in non-SMA regions. In 2005, they stood at 62.0% of the national average in the SMA and 134.8% in non-SMA areas―representing a cost level roughly half that of the rest of the country. From 2005 to 2019, these costs increased in the SMA (+7.8%) and declined in non-SMA areas (-1.2%), but the SMA’s substantial advantage endured. The decline in accommodation costs observed in non-SMA areas appears to reflect improvements in urban infrastructure, including public transportation in major provincial cities, as well as developments associated with balanced national development initiatives, such as Innovation Cities and Sejong City (see Appendix)
Urban accommodation costs were substantially lower in the SMA, only marginally narrowing the regional gap.
The SMA’s growing productivity advantage drove further concentration toward the region from 2005 to 2019.
How did the changes observed between 2005 and 2019 affect individual cities and, more broadly, the national city size distribution? The spatial general equilibrium framework allows for the decomposition of changes in city size distribution into components attributable to productivity, amenities, and urban accommodation costs. While Kim (2025) presents city-level results nationwide, this analysis focuses on the aggregate SMA share and its change.
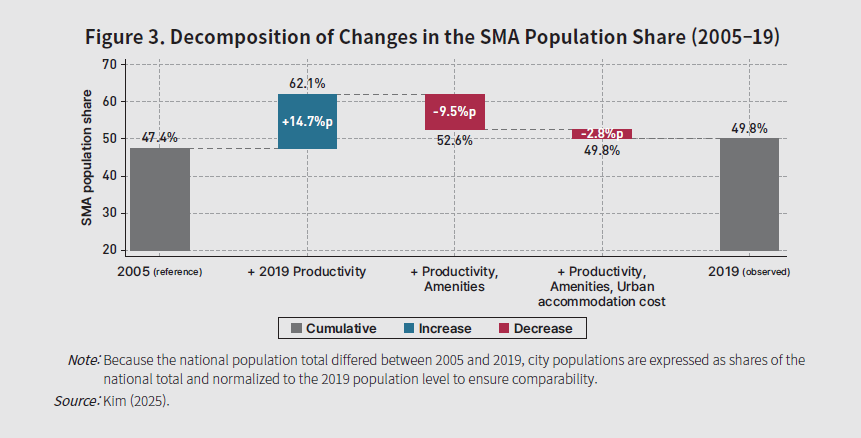
Figure 3 illustrates the factor contributions to changes in the SMA population share, derived from counterfactual city size distributions constructed by sequentially substituting 2019 values of productivity, amenities, and urban accommodation costs into the 2005 baseline. It shows that productivity was the main driver of the rise from 47.4% in 2005 to 49.8% in 2019. Holding other factors at 2005 levels while productivity alone follows the 2005?19 trajectory, the population share would have risen by 14.7%p to 62.1%. However, the other two factors―amenities (-9.5%p) and urban accommodation costs (-2.8%p)―operated in ways that offset this effect, resulting in the observed 2.4%p rise to 49.8%.
Reversing the concentration toward the SMA remains elusive without closing the regional productivity gap.
These results underscore both the potential and the limitations of balanced national development initiatives. The shifts in city characteristics and city size distribution over the past 15 years suggest that this policy effort, by expanding regional infrastructure investment that lowered urban accommodation costs, was partially effective in moderating SMA concentration. Nevertheless, decades of sustained infrastructure investment turned out to be insufficient to reverse the trend of SMA concentration. The finding that productivity changes alone could have raised the SMA share to above 60% suggests that, as long as productivity gaps persist, reductions in urban accommodation costs by themselves are unlikely to be sufficient to overturn this concentration trend.
Ⅳ. Industrial City Decline and the Development of Regional Hub Cities
This section presents counterfactuals based on the city-specific characteristics estimated earlier. The analysis first assesses the impact of industrial city decline during the 2010s on SMA concentration by dividing the sample period into sub-periods. It then explores the prospect of mitigating SMA concentration through development strategies for regional hub cities.
1. Industrial City Decline and SMA Concentration
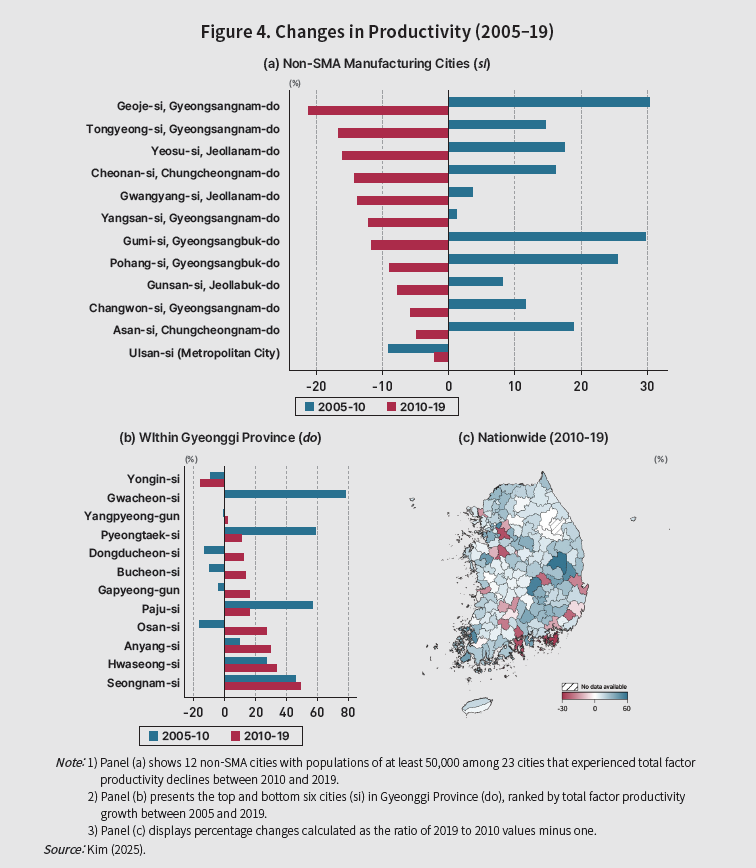
Beginning in the 2010s, productivity fell significantly in traditional manufacturing hub cities, such as Geoje, Gumi, and Yeosu (Figure 4). This downswing marked a distinct shift from the 2005-2010 period, when productivity had been rising across all cities except Ulsan. The downturn appears to be rooted in a regional economic contraction triggered by the shipbuilding slump, automotive restructuring, and stagnation in the steel industry, which stands in contrast to the sustained growth seen in the SMA, particularly in Gyeonggi Province.
Industrial restructuring in the 2010s led to productivity declines in non-SMA industrial cities.
Had productivity in these manufacturing cities not faltered, what would the SMA population share have been in 2019? Two counterfactual scenarios are considered for the 2010-2019 period: one in which productivity in these cities remains at its 2010 level through 2019, and another in which it grows at approximately the national average.
Under the counterfactual where only productivity is held at the 2010 level while holding all other economic conditions at the 2019 values, the SMA population share would have been 47.2%, down 2.65%p from the observed level (Figure 5). This result implies that roughly one million residents each from cities in the SMA and from non-SMA cities would have relocated to these 12 manufacturing cities, for a total of approximately two million. Put differently, in the absence of a productivity decline in these industrial cities during the 2010s, the SMA population share could have been at its 2005 level, despite continued productivity growth in the SMA, including Gyeonggi Province.
Without the productivity decline in non-SMA industrial cities, concentration toward the SMA would have been moderated.
What if productivity in the industrial cities had not merely remained at the 2010 level but had instead increased at the national average rate? Applying the national average of 14% puts all cities above Seoul, except Tongyeong, Yangsan, and Cheonan, which lag furthest in productivity. Under this scenario, these cities would have expanded even more, and the SMA population share is estimated to have declined to 43.3%. The total population inflow into the 12 cities would have more than doubled, reaching approximately five million.
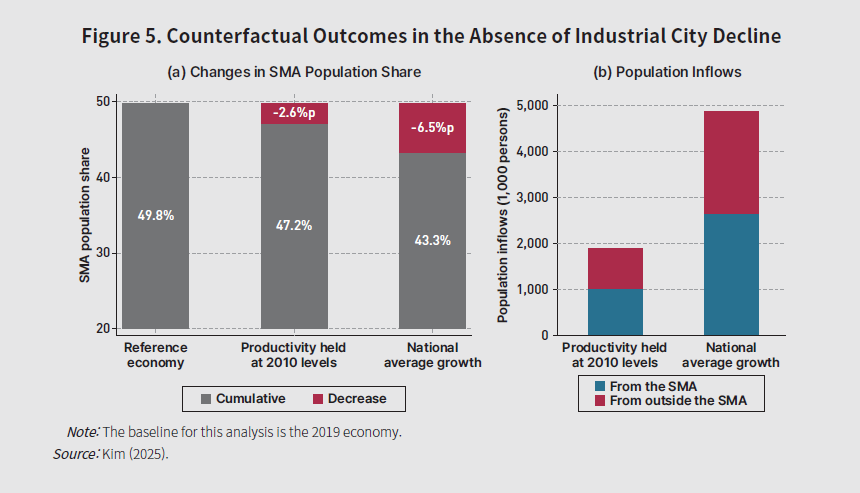
In both counterfactuals, the 12 industrial cities draw population roughly equally from the SMA and non-SMA regions, yet the two scenarios produce different changes in the overall city size distribution. Under the scenario holding productivity at 2010 levels, population outflows occur primarily from large cities in the SMA.
Had productivity in the industrial cities grown at the national average rate, it could have reversed the trend of SMA concentration.
Under the scenario of additional growth in manufacturing, by contrast, population outflows from both large SMA cities and small non-SMA ones into the industrial cities. Put simply, had productivity in regional industrial cities remained at their 2010 levels, population outflows toward the SMA could have been lower than the observed counterpart. However, had these cities’ productivity increased, reducing SMA concentration would have come at the cost of accelerated population outflows in smaller non-SMA cities.
2. The Feasibility of a Regional Hub City Development Strategy
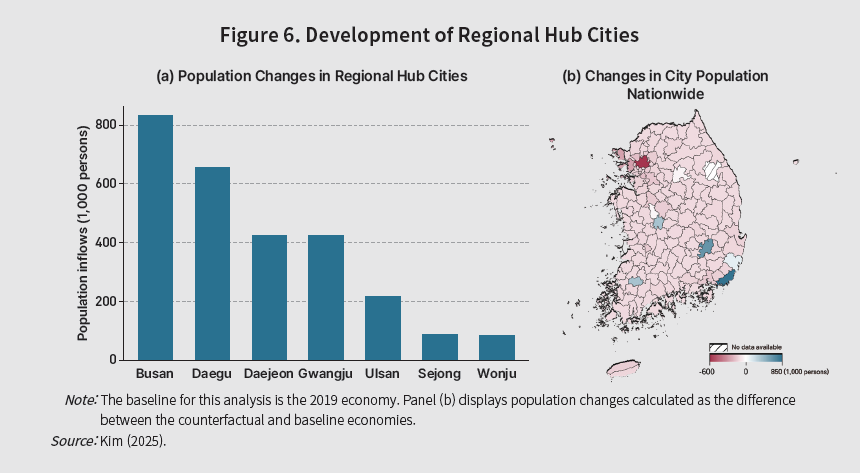
In addition, promoting megaregional zones (kwon ) centered on hub cities has been proposed as a strategy for balanced national development and intra-regional growth. To assess feasibility, this subsection considers fostering regional hubs to lower the SMA population share to 46%, the 2000 level. Given the central role of productivity in the earlier results, this simulation assumes a uniform, permanent productivity increase across all hubs. The seven regional hubs, including metropolitan and special self-governing cities, are Daejeon and Sejong (Chungcheong-kwon), Gwangju (Honam-kwon), Ulsan and Busan (Gyeongnam-kwon), Daegu (Gyeongbuk-kwon), and Wonju (Gangwon-kwon, which does not contain a metropolitan city).
Substantial productivity gains in regional hubs are essential to reduce the SMA population share.
According to the model, as of 2019, the 46% target would require an average 8.2% productivity boost across the seven hubs, with inflows of 100,000?800,000 residents per hub (Figure 6). For perspective, Daejeon recorded a comparable productivity gain (8.7%) in the 2010s. Achieving the target would therefore require all seven hubs to simultaneously receive productivity gains on par with Daejeon’s performance during that decade.
The question is whether fiscal investment can trigger sustained productivity improvements of this magnitude. Sejong provides a useful reference (see Appendix).11) The city received approximately 8.5 trillion won in public investment between 2006 and 2019 (roughly 600 billion won annually), sharply reducing its urban accommodation costs. Once infrastructure construction was largely complete in the 2010s, however, productivity growth fell below the national average, constraining further population inflows.
Triggering such productivity gains through fiscal investment is uncertain; sustaining them across all seven hubs, even more so. Even if successful, the SMA would still account for 46% of the national population, highlighting the strategy’s inherent limitations. Should policymakers nevertheless pursue hub-based dispersion, resources must be concentrated selectively on fewer cities. Productivity growth, not infrastructure provision, must be the explicit, measurable objective.
Productivity gains achieved through fiscal investment involve high uncertainty and therefore require a cautious, selective approach.
V. Conclusions and Policy Implications
Analysis of 161 cities and counties nationwide from 2005 to 2019 indicates that the growing relative productivity advantage of the SMA was the primary driver of its rising population share. The simultaneous divergence of productivity growth in the SMA and declines in non-SMA industrial cities triggered a structural shift in the national urban landscape that transcends regional boundaries. Changes in both urban accommodation costs and amenities partially offset the resulting concentration pressure. Notably, the development of Innovation Cities and Sejong in the 2010s reduced accommodation costs and spurred population growth, but population inflows were limited due to the lack of robust productivity growth.
SMA concentration since the 2000s has been closely tied to its growing relative productivity advantage.
Substantial regional productivity gains can meaningfully offset SMA concentration.
The simulation results―demonstrating that the SMA population share could have been at the 2005 level, had productivity in regional industrial cities remained stable―underscore the significance of urban productivity in shaping city size distribution and spatial structure. However, while enhancing the productivity of selected cities can indeed curb SMA expansion, this path is fraught with cost burdens and uncertainty.
These findings offer several implications for the approach and feasibility of balanced national development policy. First, for such policies to be effective, developing tools to materially improve regional productivity must precede infrastructure provision. Only when productivity improves can population inflows be sustained and regional economic growth translate into national growth. For example, the efficacy of fiscal investment can be enhanced by relocating and cultivating firms and talent or prioritizing targeted industrial policies.
To avoid compromising national growth in this process, productivity in in-migration cities must increase sufficiently to offset the losses incurred by out-migration cities. Developing new cities in remote or underdeveloped sites often exhausts the lion’s share of available resources on building urban infrastructure, leaving insufficient capital for productivity investment. Such an approach struggles to achieve balanced development: without productivity gains, population inflows cannot be sustained. It also risks depressing national growth by failing to offset productivity declines in out-migration areas.
Spatial policy should pivot from infrastructure provision toward driving tangible regional productivity gains.
Second, narrowing the SMA-non-SMA gap will inevitably widen disparities within non-SMA regions. The two forms of inequality, between regions and within regions, cannot be reduced simultaneously unless the population distribution becomes uniform. Resources must therefore be concentrated selectively on cities with strong economic potential. For instance, the second round of public agency relocation should cluster institutions in Sejong and a few select large non-SMA cities to leverage existing infrastructure and maximize agglomeration economies, rather than dispersing them across several new cities. Innovation Cities likewise require rigorous evaluation to identify which merit continued investment.
In sum, if reducing SMA concentration is the primary goal of spatial policy, restructuring non-SMA regions around large cities would offer the most effective path forward. Declining industrial cities may also serve as viable candidates where industrial and spatial policies align. By leveraging agglomeration economies, raising productivity in large non-SMA cities and industrial centers could create a dual benefit: it curbs monocentric concentration while enhancing national economic welfare. To support this approach, existing spatial redistribution mechanisms such as intergovernmental transfers should expand their objectives beyond supporting lagging regions to include optimizing the national city size distribution.
Restructuring regional spatial configurations around large hubs can help reduce the gap with the SMA.
A productivity-oriented approach will inevitably bring the decline of many small cities. Though this study’s model does not account for demographic factors, aging and population loss will likely accelerate this decline. Small city residents require support, but assistance should shift from infrastructure investment to direct welfare support.
Infrastructure investment in small cities often costs more than it benefits. For example, Japan’s massive rail expansion in the 1980s and 1990s produced large deficits as maintenance costs mounted and ridership fell with population decline. For small cities where accommodation costs become prohibitively high, subsidizing residents’ relocation to regional hubs or their suburbs is more costeffective over the long run. For those unable to relocate, particularly the elderly, residency stipends with a sunset clause could be a practical alternative. Importantly, these programs should be framed as resident support, not population attraction, to avoid misleading policy signals.
Central coordination is crucial for policy efficacy, and decentralization must be aligned with resource allocation efficiency.
Lastly, though not examined in detail here, achieving efficient spatial resource allocation requires central government coordination. The central government corrects market-driven over- and underconcentration of cities while mediating local government interests to ensure policy effectiveness. Decentralization and bottom-up approaches have gained prominence recently, but policymakers should recognize that such frameworks can generate inefficiencies in public finance, governance, and resource allocation―potentially undermining both regional and national economic growth.
Appendix
Changes in City Characteristics: Innovation Cities and Sejong
In 2005, before the construction of Innovation Cities and Sejong City, productivity levels in the target cities―88.4% in Innovation Cities and 96.1% in the former Yeongi County of Chungcheongnam Province―were, on average, lower than those in non-target cities (100.5%) (Appendix Figure 1). By 2019, after construction and the first phase of public agency relocation, the average productivity growth rate in Innovation Cities (16.4%) was broadly comparable to that in non-Innovation Cities (16.1%), leaving the productivity gap largely unchanged. Sejong (24.5%) outpaced non-Innovation Cities, narrowing the gap, but this was far below Seongnam City (117.9%), home to Pangyo Techno Valley, over a similar period. Sejong’s was particularly strong between 2005 and 2010 (17%), although this figure may have been overstated due to large initial capital injections that inflated GRDP during the early development phase. After Sejong’s official establishment and the beginning of public agency relocation in 2010, productivity growth from 2010 to 2019 slowed to just 6.4%. Over the same period, Seongnam recorded 49.2% growth.
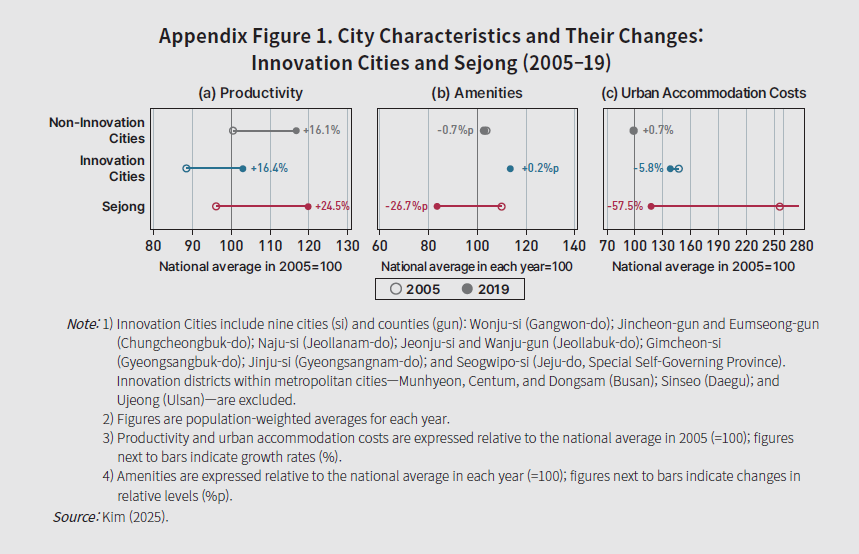
Urban accommodation costs in the target cities―146.9% in Innovation Cities and 276.8% in the former Yeongi County of Chungcheongnam Province―were, on average, higher in 2005 than in non-target cities (97.8%). Between 2010 and 2019, however, urban accommodation costs declined in the target cities, with a particularly sharp drop in Sejong, where these costs fell by 57.5%. Combined with the productivity changes, these patterns suggest that the construction of Innovation Cities and Sejong enhanced urban accommodation capacity but did not generate an economic pull sufficient to attract large-scale inflows. Sejong’s population growth stalled around 400,000―roughly half the target of 800,000.
The decline in Sejong’s amenity estimates needs careful interpretation. In the model, population inflows are predicted based on reductions in urban accommodation costs and increases in productivity. In practice, actual population inflows fell short of the model predictions, resulting in a decline in the city’s amenity estimate. This finding further highlights the limitations of large-scale infrastructure investment as a means of generating sustained incentives for migration.
- CONTENTS
-
- I. The Challenge of Persistent Capital Concentration
- II. Determinants of City Size
- III. The Impact of Changing City Characteristics on SMA Concentration
- IV. Industrial City Decline and the Development of Regional Hub Cities
- V. Conclusions and Policy Implications
- Appendix
- Key related materials
We reject unauthorized collection of email addresses posted on our website by using email address collecting programs or other technical devices. To access the email address, please type in the characters exactly as they appear in the box below.
Please enter the security code to prevent unauthorized information collection.